Sandoval was the 2nd worst player in MLB

This graph pretty much tells you everything you need to know about Pablo Sandoval getting designated for assignment by the Red Sox today.


Alexei Ramirez finished out a contract in 2015, and then signed for $3M with the Padres, where he put up a disastrous 2016 and was released.

Full data available.

7 Games, 0 Drama

A Game 7 is the most exciting thing in sports–the ultimate in win-or-go-home, do-or-die intrigue. A seven game series with no drama is like a Shakespeare play with no drama, and yet somehow the Giants and Royals are on the verge of providing just that.

Discussions of Madison Bumgarner’s brilliance, of Yordano Ventura’s unheralded dominance (2-0, 12 1/3 innings pitched, 2 earned runs), of the whether this’ll be KC’s Cinderella Year or the third installment of San Francisco’s Grover Cleveland-ish non-consecutive championship run are all great, but the games themselves? Not so much. After Game 5, we concluded that this was on pace to be the most boring six or seven game series ever, as measured by the Exciting Game Index. After last night’s 10-0 snoozer, with an EGI of 11.90, the 2014 World Series is one marginal game away from being the least exciting 7-game World Series of all time.

Game 6 was the least exciting World Series game in 46 years, and 6th least exciting World Series game ever.

Least Exciting World Series Games by EGI
Year Game
EGI
Comments
1960 Game 3 8.71 Yankees scored 6 in the first against the Pirates as Vinegar Mizell only recorded one out in the shortest start in World Series history.
1959 Game 1 9.46 White Sox jumped out to an 11-0 lead by the 4th and crushed the Dodgers in the opening game.
1967 Game 4 10.42 Cardinals score 4 in the first and Bob Gibson throws a complete game shutout against the Red Sox.
1923 Game 5 11.35 Yankees score 7 in the first two innings to roll over the Giants.
1968 Game 6 11.36 Tigers score 10 in the 3rd and beat the Cardinals 13-1.
2014 Game 6 11.90 Last night’s game.

Across all World Series, the cumulative scores range from 80 – 310. The 2014 World Series is currently at 148, which is 46 points below average. Because there’s only one game left in the 2014 World Series, Game 7 would have to be significantly above average, roughly on par with this 12-inning Game 4 from 2003, just to be an above average World Series. But that’s considering all World Series, even ones that only last 4, 5, and 6 games. When only comparing to other 7-game World Series, the 2014 has a chance to be the worst. More stunning, in order to become an average 7-game World Series, tonight’s Game 7 would have to be the most exciting game ever played in playoff history. Even if an exhilarating Game 7 materializes, the 2014 World Series will likely rank in the bottom-10 of 7-game World Series.

Least Exciting 7-Game World Series
Year Number of Games
Cumulative EGI
2014 6+ 147.97+
1965 7 167.76
1968 7 167.78
1967 7 177.96
1945 7 184.49

The 1965 series featured amazing pitching from both sides, just never on the same day. Koufax and Kaat matched up three times, including in Game 7 on two days’ rest. Koufax’s bullpen let him down in Game 2, and Kaat couldn’t get past the 3rd inning in Game 5 or 7. In all of the games, the eventual winning run was scored by the 6th inning, and in six of the games, it was scored by the 4th inning. In every game, the winning team’s starting pitcher threw a complete game, with no situations requiring the use of their bullpen.

There’s only about a 13% chance that this World Series ends as less exciting than the 1965 Series. The chart below illustrates the range of possibilities for 2014, compared to 1965. The high end shows what would happen if the Royals and Giants teamed up to play the most exciting game in World Series history.

Bet on the Giants, but expect the Royals to win Game 6

Vegas has odds of -138 for the Royals to win tonight, equating to a 58% chance of winning the game.

Historically speaking, home teams down 3-2 in the World Series win 70% of Game 6’s (23-10).

The Royals are effectively a +3 WAA (.519) team with Yordano Ventura starting, an estimate made by calculating Wins Above Average for the entire Royals, less their starting pitching. The Giants are +3.8  WAA (.523) team with Jake Peavy starting by the same estimate. The home team has a built in 54% advantage in baseball. Given this, using Bill James Log5 formula, this means the Royals are 53.6% to win Game 6.

There is some arbitrage in reality vs. Vegas model, which has priced the Royals higher than the calculated 53.6%. The Vegas lines may be over counting the Royals home field advantage and the historical averages. Because the historical average is such a small sample with varying qualities of teams, it’s a no-brainer to bet on the Giants if someone gives you +128 odds. The real money line should be closer to +115.

How often has Vegas been wrong on the Royals this year with a -138 line? In 2014, they had 45 games where the line was at or more favorable than -138. They won 58% of these games, which is exactly in line with what a -138 line should generate. They appear to have underperformed in games with a line more favorable than -160, but the sample size is too small to understand if Vegas misjudged the odds in that case.

2014 the Least Exciting World Series Ever?

It’s very possible that you’re witnessing history in the 2014 World Series, but not the kind that’s very memorable. The 2014 is stacking up to be one of the worst World Series ever in terms of exciting games, as measured by EGI.

  • Game 1 was an absolute sleeper, with the Giants jumping out to a 5-0 lead before winning 7-1. EGI: 16.62.
  • Game 2 was slightly better, as the Royals waited until the 6th before opening it up against the Giants and winning 7-2. EGI: 32.97
  • Game 3 was another below average game, as the Royals took a 3-0 lead, and while the Giants came back to make it 3-2, they never really threatened beyond scoring those additional runs, and the Royals cruised to a 3-2 win. EGI: 32.72.
  • Game 4 had a bit of back and forth, as the Giants came back from a 4-2 deficit in the 5th inning, but they piled on quickly and put the game out of reach. EGI: 32.58.
  • Game 5 was another boring game, with the Royals never threatening the Giants lead after the 5th. EGI: 21.16.

What is going on with the Royals? This was one of the most exciting teams ever early in the playoffs. All of a sudden, they can’t even have an above average (33.5) game. Well, a lot of this is luck, but it doesn’t stop us from taking a look at where this World Series could rank.

Year Number of Games
Cumulative EGI
1989 4 80.41
1963 4 111.82
2007 4 114.51
1928 4 120.50
1966 4 121.55

The 2014 Series is currently sitting at 130.89, which puts it 11th overall. But they’ve already played 5 games!

Year Number of Games
Cumulative EGI
2014 6+ 136.05+
1951 6 171.42
1930 6 174.32
1977 6 177.09
1906 6 177.68

This series is going to have a 6th game, and unless we see something in the top 120 games in World Series history (79th percentile), it’s going to be the least exciting 6 game World Series in history.

Open EGI Data

In case you wanted to see all of the World Series data, check this Google Spreadsheet.

You will see individual game rankings on the first tab, and cumulative series totals on the second tab.

I also have put the 2004 to 2013 complete game index (not including playoffs), up if you want to take a look.

What is EGI?

The origin of the Exciting Game Index (EGI) is the 2008 ALCS. Game 5 was particularly riveting. Let me remind you: the Rays were beating the Red Sox 3 games to 1 and jumped out to a early lead of 5-0 against Daisuke Matzusaka. By the 4th inning, the game, the series, the season, looked over for the Red Sox. When the Rays piled on to make it 7-0 in the 7th inning, the Red Sox staff was probably taping up plastic in the Rays visiting clubhouse. And then something funny happened: the Red Sox won the game. Mind you, this isn’t a feel good Red Sox story (cf. 2004): the Red Sox lost this series in 7 games. However, there were few people that would doubt that Game 5 was a very exciting game to watch. A huge, improbable comeback finishing with a walk off win in the playoffs? This is why we watch baseball.

Statistically, it’s not hard to quantify the Red Sox chances of coming back from a 7-0 deficit with 2 outs in the 7th inning. It’s less than 1%. Here’s what happens when you graph the Red Sox win expectancy in that game:Win Expectancy vs. Plays

What if the Red Sox had lost that game after coming all the way back? No matter, it still would have been exciting to the casual baseball observer without a rooting interest. I reasoned that it wasn’t necessarily the outcome of the game that mattered, but how we got there. No one doubts that a 7-0 game is a laugher, and relatively boring, or that a 1-0 game is going to be exciting to watch all the way through. But, we’ve all see boring 3-0 games, where one team just dominates the other for 9 innings. That’s no fun either. What matters is the high leverage situations that teams put themselves into. A 1-0 game where the bases are loaded every inning but no one can manage to score is inherently more exciting than a 1-0 game that neither team can manage to get on base.

In an attempt to measure this, EGI was born. As it turns out, Game 5 a very exciting game when compared to other games in post season history. From 1985-2008, it was the 6th most exciting ALCS game.

EGI averages 33, and ranges between 8-75. Anything above 65 is a top 2% game.

Here’s the formula: the sum of all win expectancy changes divided by the total number of plays, multiplied by 1000.

I swear, it won't be this hard.

I swear, it won’t be this hard.

Was the Wild Card Play-In Game the Most Exciting Game … Ever?

In a word, no. But that doesn’t mean it wasn’t one of the best games of the year.

Many people watched the Royals beat the Athletics in 12 innings on Tuesday night and proclaimed it as the most exciting game of the year. It was an incredibly exciting game, but clearly not the most exciting game. How does it compare to the other 2427 games played this year? How does it compare to the other elimination games in baseball history?

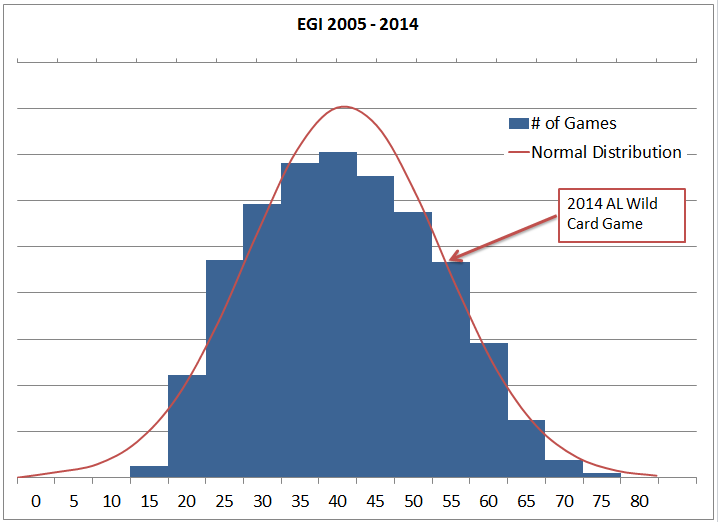
The AL Wild Card game scored a 52.20 on the Exciting Game Index (EGI), which is calculated by taking summing the difference in Win Probability on each individual play, and dividing by the total number of plays in the game. Thus, a game where it’s never in doubt (like the Giants/Pirates NL Wild Card game which scored 15.58) will have a low score, and a game like the Royals/Athletics game, where the lead kept changing, will have a high score. EGI 33.6 is the decade historical average, with a minimum of 6.59, and a maximum of 73.78.

I swear, it won't be this hard.

I swear, it won’t be this hard.

The distribution of games (2004-2014) follows a roughly normal distribution (bell curve) as shown below. The 52.20 for the AL Wild Card Game puts it near the top of the chart – actually in the 93th percentile for exciting games since 2004. It is ranked 1,765th out of 26,727 games played (including playoffs).

AllGames 2005-14

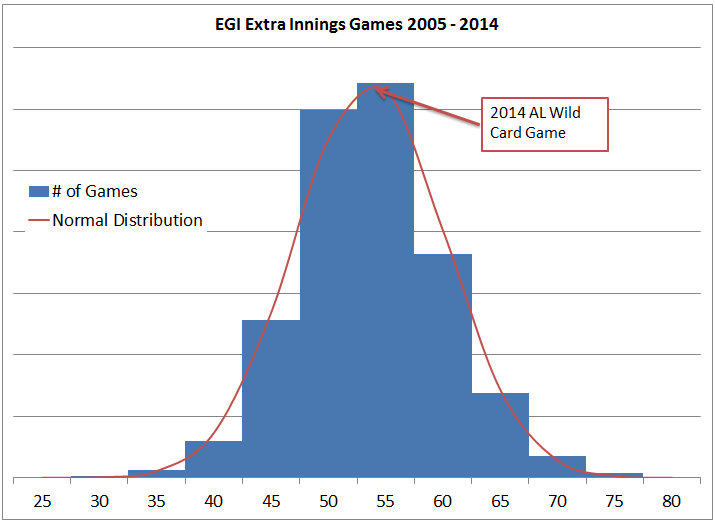
Unsurprisingly, most of the very exciting games need extra innings to be decided. There are large swings in extra innings, as even 2-out baserunner will dramatically improve a team’s win probability. The average extra innings game has an EGI of 51.15, and the below distribution. In fact, only 9 games out of 2,334 extra innings games are lower in excitement than the average game (EGI 33.6). It is worth noting that there were 775 (3.2%) of 9 inning games that were more exciting than the AL Wild Card Game. If you knew that the 2014 Wild Card game was going to go into extra innings, you would have expected a game of roughly this caliber. It is right in the middle of the distribution, ranked 891st out of 2,115 extra inning games this decade.

ExtraInnings 2005-2014

The real drama, as many have pointed out, was not derived from the actual game, but from the win-or-go-home nature of the one-game playoff. There have been 16 one-game playoffs in history. As a result, the population isn’t big enough to do a fair comparison for this game. However, the playoffs provide a proxy, as the importance of each game is extremely high compared to a 162-game regular season. Since 1903, there have been 1406 playoff* games. When compared to all playoff games, the game ranks in the 93rd percentile. The average was 33.9, which is very close to the 33.6 historical average EGI.

PlayoffsAll

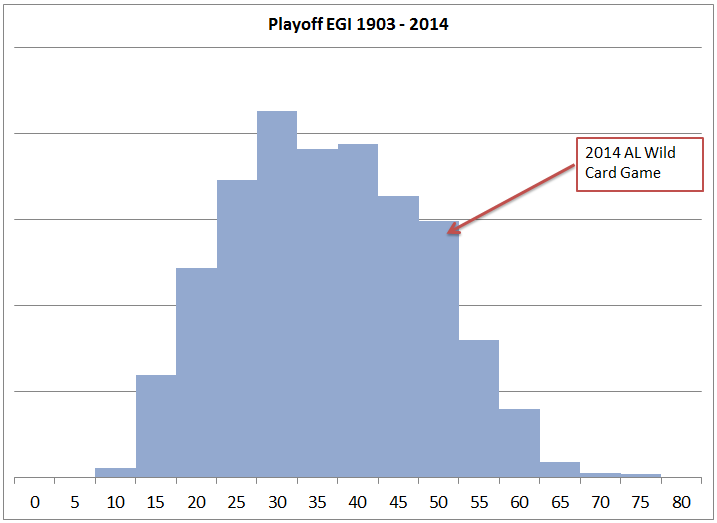
*includes all playoff series, all one-game playoffs, and all Wild Card playoffs (since 2012)

Lastly, there are the Game 7s (or Game 5s in some series) where both teams have to win. The population is getting very small now, only 100 games, and the AL Wild Card game holds up against other high pressure situations, showing up as the 9th best do-or-die game in history.

There are two recent one-game playoff situations that show up higher than the 2014 Wild Card game. The 2007 one-game playoff between the Rockies and the Padres, which went 13 innings (EGI 58.66) and the 2009 one-game playoff between the Twins and the Tigers, which went 12 innings (EGI 72.81). The 2009 game is the highest ranked playoff game of all time. It is also the second highest ranked of any game in the last decade.

Given the stakes – both teams must win – and the level of play, it’s not hard to conclude that the 2014 AL Wild Card Game between the Royals and the Athletics was a game that should go down in history as one of the most exciting ever played, but the “Best Game Ever” title still belongs to the 2009 one-game playoff between the Twins and the Tigers.


The United States of Baseball

The New York Times Upshot did a great interactive on the various fan allegiances of baseball fans by zipcode. The results weren’t surprising: the Yankees are the default where there’s no teams, the Mets and A’s don’t have a plurality, and the Braves and Cubs expand well beyond their geographies – mostly because of their long standing Regional Sports Network broadcast reach. The granularity of the detail produced, however, led to some great specifics – there’s the disputed New England border that runs through Connecticut, the Northern California/Southern California dividing line pinpointed at Tulare, CA, and many other fun tidbits.

Nate Silver of Five Thirty Eight tweeted about how his office was using the map to define geographic boundaries, which I thought was enlightening.


Pennsylvania can’t be the Midwest, but Pittsburgh can’t be the Northeast. Drawing region boundaries through states just makes sense. Using the NYTimes Baseball Map just made sense. Using that methodology, I decided to take the example to the logical conclusion: redefine the US by baseball allegiance.

Regions_of_MLB

Regions_of_US

There were three difficult areas on the map.

  1. What to do about the Mid-Atlantic? I’ve always thought of Philadelphia as firmly Northeast, and Virginia as the South, but clearly wedged in between the two is the Mid-Atlantic. I don’t think anyone would dispute this region’s existence. However, it’s very small, especially by geographical area. I wanted to make the Mid-Atlantic bigger, but how? It made more sense to expand it south than north. Very few people from Philadelphia would call their home “Mid-Atlantic” and I would guess that almost all would call it “the Northeast.” Expanding south meant shrinking the region known as the South, and doing so along the baseball borders means that all that unincorporated land currently known as southern Virginia, North Carolina, and northern South Carolina would be part of Mid Atlantic. This wasn’t too bad, for instance, Raleigh and Richmond can definitely qualify as Mid-Atlantic. In fact, Five Thirty Eight also did a study on what the local population considers themselves, and only about 50% of North Carolinans consider themselves part of the South. However, redrawing the Mid-Atlantic in this way would mean expanding west into the unincorporated land of West Virginia. This just feels wrong. How can a state be Mid-Atlantic if it doesn’t have a coast line? As a result, I held the (very small) Mid-Atlantic region where it was.
  2. How far does the Mid-West go? Pretty far, it turns out. I didn’t want to subdivide the Mid-West into things like North Central, Plains, High Plains because, while geographically impressive, there’s simply not a lot of people there. It’s not that they don’t have their own identity, as much as there’s not enough critical mass to make it an important enough region, on par with the Mid-West for instance.
  3. Is Texas a Thing? Yeah, Texas is a thing, but I put them in the Southwest. People from Arizona or New Mexico might not like this, but I grouped these together. It was a little difficult to figure out where to stop the Southwest, but at some point, you hit the Rocky Mountains, and a very different fan base in Colorado. I decided to put the unincorporated land of Nevada in the Mountain West.

It’s possible that New England isn’t its own region, just like the Mid-Atlantic, but it’s tough to put Baltimore, Washington, and Northern Virginia in the same region as Boston. I took a look at the population numbers for the 60 largest Metropolitan Statistical Areas based on 2013 estimates and divided them up by my new region assignment. The 60 largest MSAs get you about 183M people, of 313M in the US. New England does seem to hold its own, as it’s slightly larger than the Pacific Northwest, and much bigger than the Mountain West. The problem with regions like New England, Pacific Northwest, and Mountain West is that they are really based only on one city. The Northeast is mostly based on one city, but it also has Philadelphia to increase its numbers.


Region Population Percentage
Mid-West          38,603,614 21%
Northeast          31,234,633 17%
Southwest          27,126,274 15%
Southern California          19,325,823 11%
South          16,165,138 9%
Northern California          13,032,565 7%
Florida          12,361,230 7%
Mid-Atlantic            8,720,597 5%
New England            7,215,300 4%
Pacific Northwest            5,924,659 3%
Mountain West            2,697,476 1%

Other fun stuff: Southern California includes Las Vegas, so maybe it needs another name. The Pacific Northwest contains Idaho, which has no coast. The Southwest includes a little bit of Louisiana. A tiny bit of Georgia sneaked into Florida, which was surprising, as I thought it would go the other way. If southern Virginia, North Carolina, and northern South Carolina were part of the Mid Atlantic, it would only have increased to about 10M in population based on the above chart, so while it would look more geographically impressive, it would still be a fairly small region.

The Mariners Have Made a Huge Mistake

Robinson Cano has convinced the Mariners to outspend the suddenly thrifty Yankees by $50M, and give him a $240M/10 year deal. This deal shoots Cano up to one of the highest paid players in baseball, and one of the largest contracts ever signed. But is it a good deal?

I looked up $100M contracts that were complete, or mostly complete that had been given to players 31+, signed through 38. I couldn’t find any. Well, I could find one, and it’s not a comp that Cano wants:Alfonso Soriano – signed 31-38 – $136M – 9.1 WAR (1.1 WAR/year)

I pulled the rest of the really big contracts, and highlighted the ones that were completely or mostly complete. Annual WAR rate in parenthesis.

Jason Giambi – age 31-37 – $122M – 22 WAR (3.1)
Todd Helton – age 29-37 – $142M – 32.9 WAR (3.6)
Mark Teixeria – age 29-36 – $180M – 16.2 WAR (3.2) – still has 3 years left
Manny Ramirez – age 29-36 – $160M – 36.6 WAR (4.6)
Vernon Wells – age 29-35 – $126M – 7.2 WAR (1.2) – still has 1 year left
Derek Jeter – age 27-36 – $189M – 41.2 WAR (4.1)
Miguel Cabrera – age 25-32 – $152M – 36.2 WAR (6.0) – still has 2 years left
Alex Rodriguez – age 25-31 – $185M – 56.4 WAR (8.0)
  • Helton ended up getting bought out of his 38-year-old season and resigned for $5M/year through 2013, but in doing so also reworked his 37-year-old season and deferred a bunch of money. I counted it as it was originally signed.
  • ARod’s listing above is the $252M contract, but he opted out, so the value was only $185M.
  • I left Sabathia off the list – pitcher.
  • Kind of funny that the Yankees have/had 6 of the 9 players above. 2 of which are salary dumps. I suppose they have a first hand view at what they’re getting into.
I ordered the above strategically – descending by age signed. Is it any surprise that the contracts given to the three players at the bottom: 25, 25, 27 in age, account for half of the annual WAR, despite being 33% of the list?

There’s also a lot of $100M+ contracts that have to play out. You can argue that the ones I’ve highlighted above are last generation, and Cano (rightfully) is valuing himself in today’s market, with what is being signed around him.

Alex Rodriguez – age 32-41 – $275M
Albert Pujols – age 32-41 – $240M
Joey Votto – age 30-39 –  $225M – hasn’t even started playing on this contract yet
Prince Fielder – age 28-36 – $214M
Joe Mauer – age 28-35 – $184M
Troy Tulowitzki – age 26-36 – $157M
Adrian Gonzalez – age 29-36 – $154M
Carl Crawford – age 29-35 – $142M
David Wright – age 30-37 – $138M

There’s a bunch of pitchers I didn’t include, but that’s basically all of the $150M+ contracts in history.

David Ortiz and 6 Game Stretches

Joe Flood and I collaborated on a quick one for David Ortiz’s best 6-game performances, shortly after his amazing World Series run.

I want to add some additional insight to the data. In order to get discrete streaks, we only took the highest streak for a period and then excluded any overlapping games. Unfortunately, this did obscure some of the data. Realistically, from 9/22/2007 – 9/28/2007, OPS 1.906, was his 4th best streak. When combined with his 9/27/2007 – 10/7/2007 streak, OPS 2.329, you get a ridiculous 10 game streak that outpaces all of his 6-game streaks in his life (except for the 6-game streak inherently included), his OPS was 1.957 from 9/23/2007 – 10/12/2007. Also, if you take a look at the streaks from 2007, he was absolutely on fire from August 18th to the end of the year:

  • 8/18/2007 – 8/24/2007 (OPS 1.702)
  • 9/8/2007 – 9/14/2007 (OPS 1.750)
  • 9/27/2007 – 10/7/2007 (OPS 2.329)

The other, slightly more obscure thing we looked at was WPA (Win Probability Added). We looked at a rolling 6-game average to see when Ortiz was the most “clutch,” fully recognizing that you have to be put into the situation, so it’s not perfectly representative of how hot Ortiz was. Obviously, 2004 playoffs was near the top of the list:

  • #1: 7/25/2006 – 8/1/2006 – WPA/G 0.250
  • #2: 8/29/2003 – 9/3/2003 – WPA/G 0.231
  • #3: 8/7/2011 – 8/13/2011 – WPA/G 0.221
  • #4: 5/28/2005 – 6/2/2005 – WPA/G 0.220
  • #5: 10/8/2004 – 10/18/2004 – WPA/G 0.214

Number 5 above is the well known ALCS comeback through Game 5 of the ALCS, when Ortiz had two consecutive walk off hits in extra innings, as well as a few other RBI. It’s worth remembering that Ortiz also had a walk off HR to win the ALDS Game 3, to eliminate the Angels earlier in the week.

But what about number 1 above? What did Ortiz do that week?

July 29th – 4 for 5, 4 RBI, 1 R, 1 BB, walk off with 2 outs in 11th. Sox win 7-6, (note he has 4 RBI – half of all runs).
July 31st – 3 for 5, 4 RBI, 2 R, 1 K, Game tying HR in 3rd, walk-off 3 R HR in 9th, down by 2 runs, 1 out. Sox win 9-8

Not a bad couple of days.

Post Navigation