The Royals are effectively a +3 WAA (.519) team with Yordano Ventura starting, an estimate made by calculating Wins Above Average for the entire Royals, less their starting pitching. The Giants are +3.8 WAA (.523) team with Jake Peavy starting by the same estimate. The home team has a built in 54% advantage in baseball. Given this, using Bill James Log5 formula, this means the Royals are 53.6% to win Game 6.
There is some arbitrage in reality vs. Vegas model, which has priced the Royals higher than the calculated 53.6%. The Vegas lines may be over counting the Royals home field advantage and the historical averages. Because the historical average is such a small sample with varying qualities of teams, it’s a no-brainer to bet on the Giants if someone gives you +128 odds. The real money line should be closer to +115.
How often has Vegas been wrong on the Royals this year with a -138 line? In 2014, they had 45 games where the line was at or more favorable than -138. They won 58% of these games, which is exactly in line with what a -138 line should generate. They appear to have underperformed in games with a line more favorable than -160, but the sample size is too small to understand if Vegas misjudged the odds in that case.
The origin of the Exciting Game Index (EGI) is the 2008 ALCS. Game 5 was particularly riveting. Let me remind you: the Rays were beating the Red Sox 3 games to 1 and jumped out to a early lead of 5-0 against Daisuke Matzusaka. By the 4th inning, the game, the series, the season, looked over for the Red Sox. When the Rays piled on to make it 7-0 in the 7th inning, the Red Sox staff was probably taping up plastic in the Rays visiting clubhouse. And then something funny happened: the Red Sox won the game. Mind you, this isn’t a feel good Red Sox story (cf. 2004): the Red Sox lost this series in 7 games. However, there were few people that would doubt that Game 5 was a very exciting game to watch. A huge, improbable comeback finishing with a walk off win in the playoffs? This is why we watch baseball.
Statistically, it’s not hard to quantify the Red Sox chances of coming back from a 7-0 deficit with 2 outs in the 7th inning. It’s less than 1%. Here’s what happens when you graph the Red Sox win expectancy in that game:
What if the Red Sox had lost that game after coming all the way back? No matter, it still would have been exciting to the casual baseball observer without a rooting interest. I reasoned that it wasn’t necessarily the outcome of the game that mattered, but how we got there. No one doubts that a 7-0 game is a laugher, and relatively boring, or that a 1-0 game is going to be exciting to watch all the way through. But, we’ve all see boring 3-0 games, where one team just dominates the other for 9 innings. That’s no fun either. What matters is the high leverage situations that teams put themselves into. A 1-0 game where the bases are loaded every inning but no one can manage to score is inherently more exciting than a 1-0 game that neither team can manage to get on base.
In an attempt to measure this, EGI was born. As it turns out, Game 5 a very exciting game when compared to other games in post season history. From 1985-2008, it was the 6th most exciting ALCS game.
EGI averages 33, and ranges between 8-75. Anything above 65 is a top 2% game.
Here’s the formula: the sum of all win expectancy changes divided by the total number of plays, multiplied by 1000.
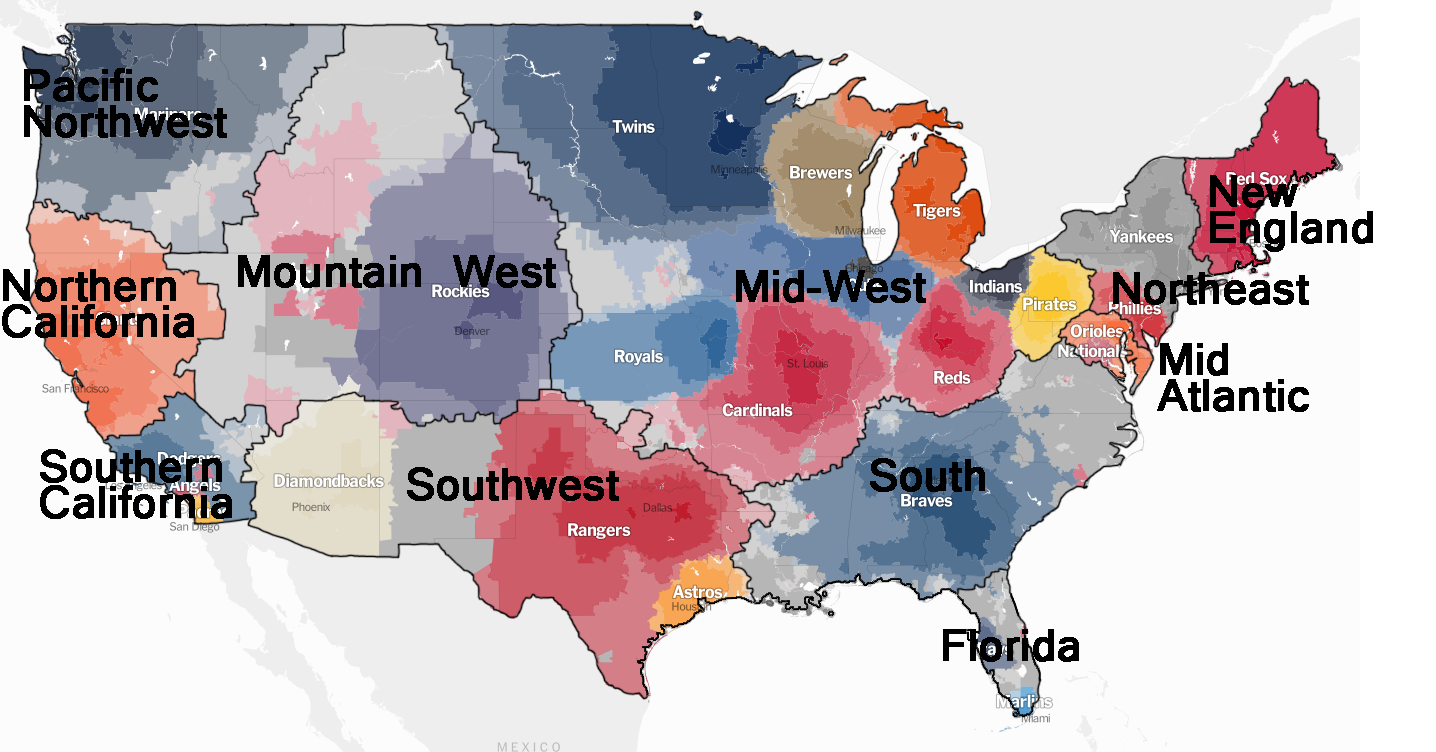
The New York Times Upshot did a great interactive on the various fan allegiances of baseball fans by zipcode. The results weren’t surprising: the Yankees are the default where there’s no teams, the Mets and A’s don’t have a plurality, and the Braves and Cubs expand well beyond their geographies – mostly because of their long standing Regional Sports Network broadcast reach. The granularity of the detail produced, however, led to some great specifics – there’s the disputed New England border that runs through Connecticut, the Northern California/Southern California dividing line pinpointed at Tulare, CA, and many other fun tidbits.
Nate Silver of Five Thirty Eight tweeted about how his office was using the map to define geographic boundaries, which I thought was enlightening.
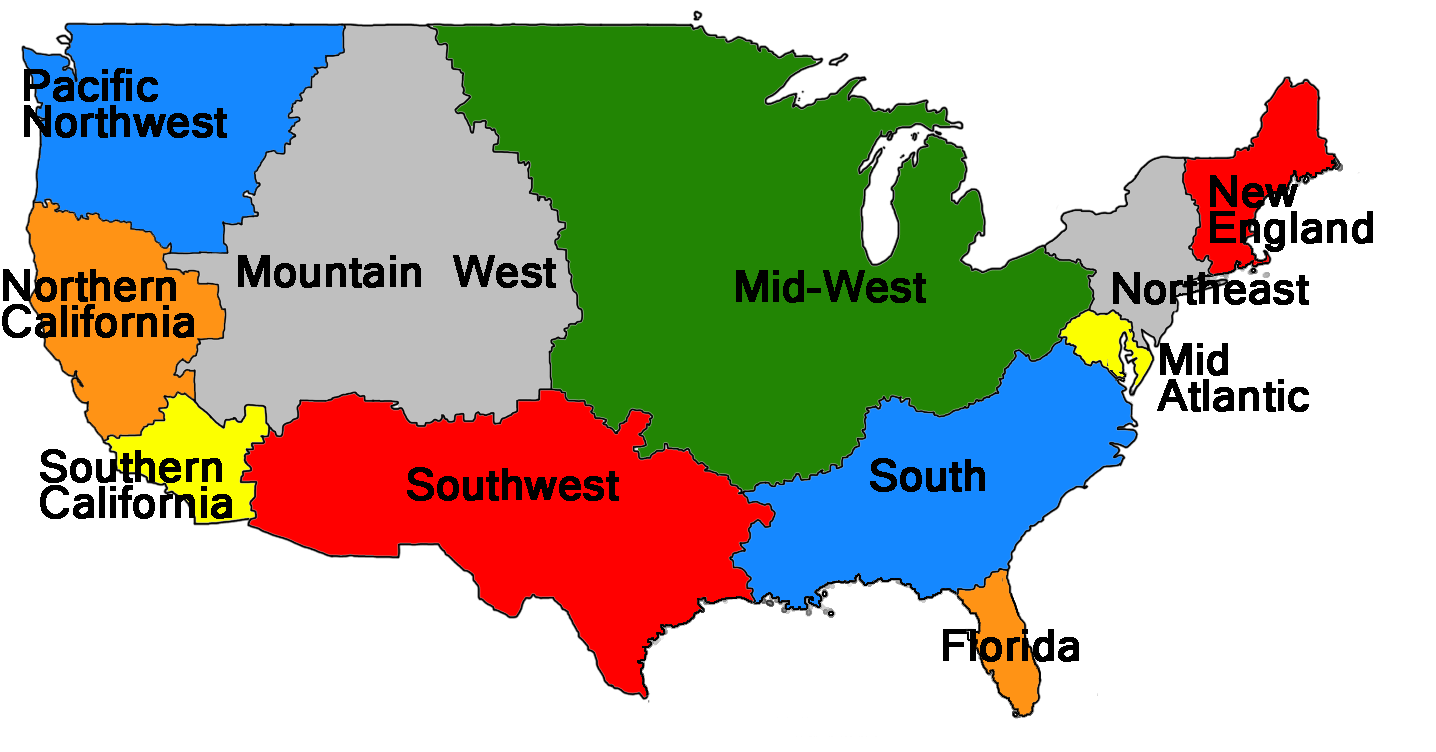
Pennsylvania can’t be the Midwest, but Pittsburgh can’t be the Northeast. Drawing region boundaries through states just makes sense. Using the NYTimes Baseball Map just made sense. Using that methodology, I decided to take the example to the logical conclusion: redefine the US by baseball allegiance.
There were three difficult areas on the map.
What to do about the Mid-Atlantic? I’ve always thought of Philadelphia as firmly Northeast, and Virginia as the South, but clearly wedged in between the two is the Mid-Atlantic. I don’t think anyone would dispute this region’s existence. However, it’s very small, especially by geographical area. I wanted to make the Mid-Atlantic bigger, but how? It made more sense to expand it south than north. Very few people from Philadelphia would call their home “Mid-Atlantic” and I would guess that almost all would call it “the Northeast.” Expanding south meant shrinking the region known as the South, and doing so along the baseball borders means that all that unincorporated land currently known as southern Virginia, North Carolina, and northern South Carolina would be part of Mid Atlantic. This wasn’t too bad, for instance, Raleigh and Richmond can definitely qualify as Mid-Atlantic. In fact, Five Thirty Eight also did a study on what the local population considers themselves, and only about 50% of North Carolinans consider themselves part of the South. However, redrawing the Mid-Atlantic in this way would mean expanding west into the unincorporated land of West Virginia. This just feels wrong. How can a state be Mid-Atlantic if it doesn’t have a coast line? As a result, I held the (very small) Mid-Atlantic region where it was.
How far does the Mid-West go? Pretty far, it turns out. I didn’t want to subdivide the Mid-West into things like North Central, Plains, High Plains because, while geographically impressive, there’s simply not a lot of people there. It’s not that they don’t have their own identity, as much as there’s not enough critical mass to make it an important enough region, on par with the Mid-West for instance.
Is Texas a Thing? Yeah, Texas is a thing, but I put them in the Southwest. People from Arizona or New Mexico might not like this, but I grouped these together. It was a little difficult to figure out where to stop the Southwest, but at some point, you hit the Rocky Mountains, and a very different fan base in Colorado. I decided to put the unincorporated land of Nevada in the Mountain West.
It’s possible that New England isn’t its own region, just like the Mid-Atlantic, but it’s tough to put Baltimore, Washington, and Northern Virginia in the same region as Boston. I took a look at the population numbers for the 60 largest Metropolitan Statistical Areas based on 2013 estimates and divided them up by my new region assignment. The 60 largest MSAs get you about 183M people, of 313M in the US. New England does seem to hold its own, as it’s slightly larger than the Pacific Northwest, and much bigger than the Mountain West. The problem with regions like New England, Pacific Northwest, and Mountain West is that they are really based only on one city. The Northeast is mostly based on one city, but it also has Philadelphia to increase its numbers.
Region
Population
Percentage
Mid-West
38,603,614
21%
Northeast
31,234,633
17%
Southwest
27,126,274
15%
Southern California
19,325,823
11%
South
16,165,138
9%
Northern California
13,032,565
7%
Florida
12,361,230
7%
Mid-Atlantic
8,720,597
5%
New England
7,215,300
4%
Pacific Northwest
5,924,659
3%
Mountain West
2,697,476
1%
Other fun stuff: Southern California includes Las Vegas, so maybe it needs another name. The Pacific Northwest contains Idaho, which has no coast. The Southwest includes a little bit of Louisiana. A tiny bit of Georgia sneaked into Florida, which was surprising, as I thought it would go the other way. If southern Virginia, North Carolina, and northern South Carolina were part of the Mid Atlantic, it would only have increased to about 10M in population based on the above chart, so while it would look more geographically impressive, it would still be a fairly small region.
Robinson Cano has convinced the Mariners to outspend the suddenly thrifty Yankees by $50M, and give him a $240M/10 year deal. This deal shoots Cano up to one of the highest paid players in baseball, and one of the largest contracts ever signed. But is it a good deal?
I looked up $100M contracts that were complete, or mostly complete that had been given to players 31+, signed through 38. I couldn’t find any. Well, I could find one, and it’s not a comp that Cano wants:Alfonso Soriano – signed 31-38 – $136M – 9.1 WAR (1.1 WAR/year)
I pulled the rest of the really big contracts, and highlighted the ones that were completely or mostly complete. Annual WAR rate in parenthesis.
Jason Giambi – age 31-37 – $122M – 22 WAR (3.1)
Todd Helton – age 29-37 – $142M – 32.9 WAR (3.6)
Mark Teixeria – age 29-36 – $180M – 16.2 WAR (3.2) – still has 3 years left
Manny Ramirez – age 29-36 – $160M – 36.6 WAR (4.6)
Vernon Wells – age 29-35 – $126M – 7.2 WAR (1.2) – still has 1 year left
Derek Jeter – age 27-36 – $189M – 41.2 WAR (4.1)
Miguel Cabrera – age 25-32 – $152M – 36.2 WAR (6.0) – still has 2 years left
Alex Rodriguez – age 25-31 – $185M – 56.4 WAR (8.0)
Helton ended up getting bought out of his 38-year-old season and resigned for $5M/year through 2013, but in doing so also reworked his 37-year-old season and deferred a bunch of money. I counted it as it was originally signed.
ARod’s listing above is the $252M contract, but he opted out, so the value was only $185M.
I left Sabathia off the list – pitcher.
Kind of funny that the Yankees have/had 6 of the 9 players above. 2 of which are salary dumps. I suppose they have a first hand view at what they’re getting into.
I ordered the above strategically – descending by age signed. Is it any surprise that the contracts given to the three players at the bottom: 25, 25, 27 in age, account for half of the annual WAR, despite being 33% of the list?
There’s also a lot of $100M+ contracts that have to play out. You can argue that the ones I’ve highlighted above are last generation, and Cano (rightfully) is valuing himself in today’s market, with what is being signed around him.
Alex Rodriguez – age 32-41 – $275M
Albert Pujols – age 32-41 – $240M
Joey Votto – age 30-39 – $225M – hasn’t even started playing on this contract yet
Prince Fielder – age 28-36 – $214M
Joe Mauer – age 28-35 – $184M
Troy Tulowitzki – age 26-36 – $157M
Adrian Gonzalez – age 29-36 – $154M
Carl Crawford – age 29-35 – $142M
David Wright – age 30-37 – $138M
There’s a bunch of pitchers I didn’t include, but that’s basically all of the $150M+ contracts in history.
I want to add some additional insight to the data. In order to get discrete streaks, we only took the highest streak for a period and then excluded any overlapping games. Unfortunately, this did obscure some of the data. Realistically, from 9/22/2007 – 9/28/2007, OPS 1.906, was his 4th best streak. When combined with his 9/27/2007 – 10/7/2007 streak, OPS 2.329, you get a ridiculous 10 game streak that outpaces all of his 6-game streaks in his life (except for the 6-game streak inherently included), his OPS was 1.957 from 9/23/2007 – 10/12/2007. Also, if you take a look at the streaks from 2007, he was absolutely on fire from August 18th to the end of the year:
8/18/2007 – 8/24/2007 (OPS 1.702)
9/8/2007 – 9/14/2007 (OPS 1.750)
9/27/2007 – 10/7/2007 (OPS 2.329)
The other, slightly more obscure thing we looked at was WPA (Win Probability Added). We looked at a rolling 6-game average to see when Ortiz was the most “clutch,” fully recognizing that you have to be put into the situation, so it’s not perfectly representative of how hot Ortiz was. Obviously, 2004 playoffs was near the top of the list:
#1: 7/25/2006 – 8/1/2006 – WPA/G 0.250
#2: 8/29/2003 – 9/3/2003 – WPA/G 0.231
#3: 8/7/2011 – 8/13/2011 – WPA/G 0.221
#4: 5/28/2005 – 6/2/2005 – WPA/G 0.220
#5: 10/8/2004 – 10/18/2004 – WPA/G 0.214
Number 5 above is the well known ALCS comeback through Game 5 of the ALCS, when Ortiz had two consecutive walk off hits in extra innings, as well as a few other RBI. It’s worth remembering that Ortiz also had a walk off HR to win the ALDS Game 3, to eliminate the Angels earlier in the week.
But what about number 1 above? What did Ortiz do that week?
July 29th – 4 for 5, 4 RBI, 1 R, 1 BB, walk off with 2 outs in 11th. Sox win 7-6, (note he has 4 RBI – half of all runs).
July 31st – 3 for 5, 4 RBI, 2 R, 1 K, Game tying HR in 3rd, walk-off 3 R HR in 9th, down by 2 runs, 1 out. Sox win 9-8
The Dodgers have been impressive, since June 22 only losing 12 games, winning 46, good enough for a .793 winning percentage over 2 full months of baseball. They’ve only lost back to back games twice during this run. It got me thinking about their strength of schedule.
According to the expected win percentages of the teams they’ve played all season, they’ve had a weak schedule – with their opponents averaging an expected .494 winning percentage. Since June 22nd, it’s been slightly easier, at .492.
However, their schedule does get easier, as their opponents for the rest of the season have an expected win percentage of .489.
Like most teams, they do better against bad teams than good teams: their wins average out to opponents win percentage of .492, and their losses against .497 teams. They are 23-16 against expected .500+ teams. 53-38 against sub .500 teams, which are roughly the same.
In short, the Dodgers aren’t taking advantage of an easy schedule, they’re just taking advantage of every one.
EGI is a statistic that measures each game in terms of how exciting it is. Generally speaking, anything over 60 is a very exciting game. Anything under 20 is very boring. 35 is the league average.